What Essential Resource Data Tell Us about our COVID Recovery

This piece was jointly written by Damon Francis (above), Artair Rogers, Director of California Programs, Health Leads; Alison DeJung, Executive Director, Eden I&R; Tom Tamura, Executive Director, Contra Costa Crisis Center; and Kelly Batson, Senior Vice President, Community Impact, United Way Bay Area.
As many states relax restrictions intended to slow the spread of COVID-19, communities are now returning to a society that looks drastically different from the one that existed prior to the pandemic. As a result of widespread unemployment, breakdowns in food distribution, and permanent closures of many important organizations and businesses, many face a new normal where they must now navigate an essential resource landscape that has gone from seriously strained to completely inundated.
As efforts to “flatten the curve” of COVID-19 have matured, it has become clear that we will need to turn our attention to flattening other curves —- one of those curves being the need for essential resources like food, housing, income supports, and caregiving support. As we have previously noted, “it will take extreme short and mid-term interventions and long-term policy measures to flatten the upcoming essential resource demand curves.” As we do, community-based organizations need to work together to move from a theoretical understanding of demand for essential resources to examining the specific data that should guide our interventions, just as we have with COVID-19.
At baseline, the U.S. faces large racial disparities across health outcomes, food insecurity, income and access to adequate housing and education. Just as COVID-19 has disproportionately affected Black, Latinx and Indigenous communities, we will find those same disparities in the accessibility and distribution of essential resources. As we seek to create interventions for the new demand for essential resources as a result of COVID-19, we must elevate the need for specific race/ethnicity data collection and community partnership to promote racial equity in our process to flatten the upcoming essential resource demand curves.
One important source of data on the demand for essential resources comes from community-based information and referral organizations, such as local 211 organizations, the three-digit phone number to connect people to needed resources. Other potential sources of data include online community resource databases and healthcare-based programs that screen patients for essential needs and create linkages to local resources. In order to understand the potential value of these data for tracking essential resource demand and possibly guiding short-, medium-, and long-term interventions, we plotted trends over time in requests for assistance for several organizations that provide referrals to community resources in the San Francisco Bay Area. We plotted calls, online searches, and intake assessments beginning four weeks prior to the shelter in place order and extending to four weeks following shelter in place. We also tracked changes in the most common categories of resources requested, and in the demographics of people making requests.
The website 1Degree.org, which has users throughout the Bay Area, saw a visible increase in searches for community resources, which continued through four weeks following shelter in place orders. In contrast, intake assessments at the Health Leads help-desk at Contra Costa Health Services decreased and intake assessments remained low four weeks later. Calls and web searches following shelter in place were also higher than the same time last year, while intake assessments were lower.
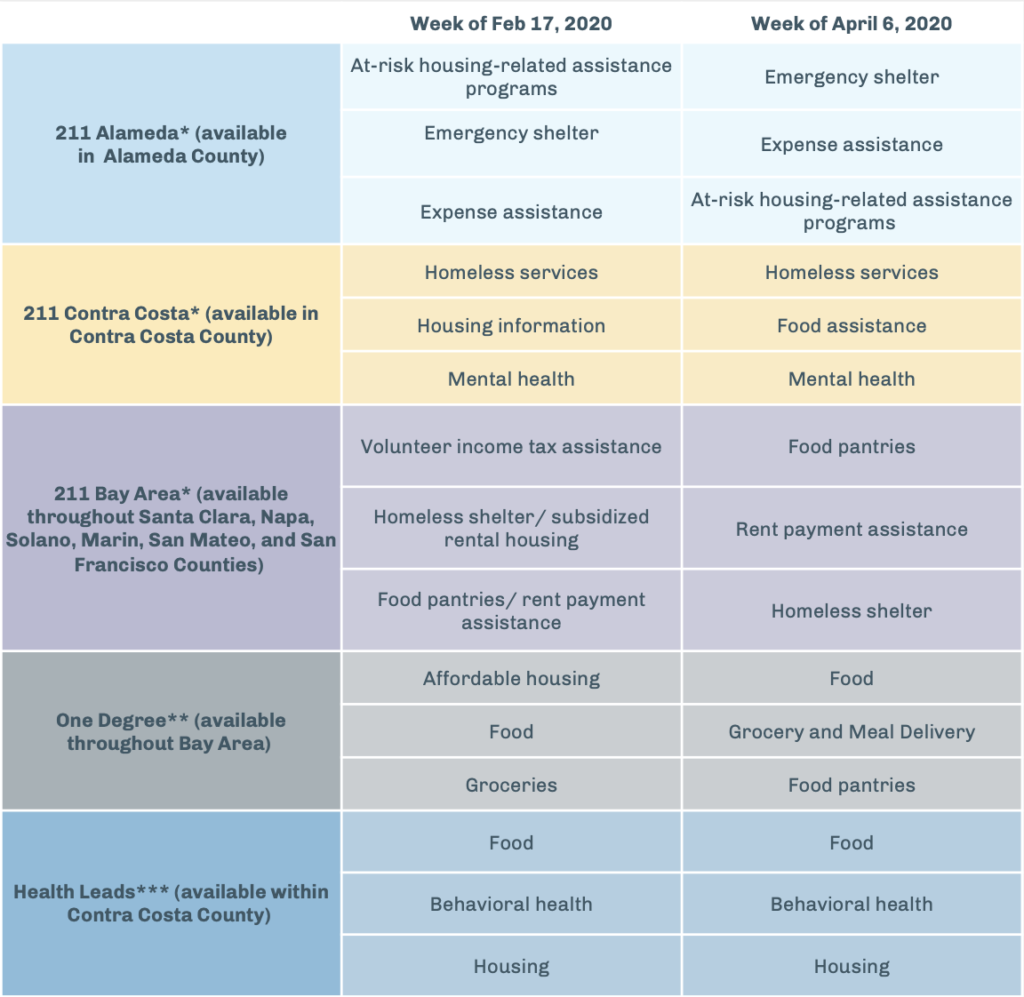
The Table below compares top requested resources from four weeks prior to shelter in place to four weeks following. With the exception of Health Leads at Contra Costa Health Services, housing and food assistance were most requested across all providers during both time periods, although there were some small shifts in the specific resources most commonly requested.
Table 1: Top Requested Resources Four Weeks Prior and Following Shelter in Place

*Local 211 data source: incoming calls and texts; ** One Degree data source: user searches within One Degree website/database; *** Health Leads data source: # of unique clients with case date of first work during the specified week.
While the data above do show some easily visible changes in calls, searches, and health care based referrals for assistance, it is far from clear that they represent a “curve” to flatten that is analogous to COVID-19 cases, hospitalizations, or deaths. The differences in the trends may have multiple explanations. For example, reductions in in-person health care visits were likely a significant reason for decreased in-person referrals to the Health Leads program, rather than reductions in demand.
Regardless of the difficulties in interpretation, the advantage of these data is that they can be collected and monitored in near real-time by zip code within a county, whereas population-based survey data to track demand for essential resources such as the Census or the Behavioral Risk Factor Surveillance System occur much less frequently. Data that are available weekly can provide critical feedback when new policies or programs are implemented. They may be most useful for generating educated guesses about the changing situation on the ground, which can then be validated and safely shared through other means. Seeing a dramatic increase or decrease in demand for a certain resource domain (i.e. food insecurity, housing insecurity, transportation) could be a leading indicator for the need of other resources. For example, data showing a sudden increase in searches or calls for limited eviction protection resources could activate the need for temporary housing supports or shelters. Similarly, calls and searches for rental assistance and additional emergency financial assistance could indicate upcoming, troubling trends around housing stability and long-term services. Harnessing this type of data in partnership with qualitative community feedback can create systems that predict future needs of communities.
Food, income, housing, and caregiving needs are both urgent and important for health and well-being. Responding to the dramatic increases in essential resource demands and flattening the curve will require experimentation and adjustment in near real-time, and grounding policymaking solidly in the experience of people with the most riding on the decisions we make. While data on requests for assistance are only one piece of understanding the essential resource demand curve, they are a critical part of the learning systems we need to urgently develop to better understand and address both the current demand and the gaps that lie ahead.
The need to effectively interrogate and fully comprehend the components of the essential resource demand curve calls for collaboration between entities that traditionally collect social needs data – like local 211s, One Degree, and Health Leads – to interpret and potentially forecast the breadth and depth of need for communities. However, this collaboration cannot solely rely on a data narrative from these stakeholders but must actively seek to promote equity and anti-racism by democratizing data. Community participation and ownership in cultivating and clarifying the data narrative accompanying the essential resource demand curve is essential. Centering the experiences and stories of the affected populations provides insight to the nuances, root causes, and systemic oppression behind the essential resource demand curve. Therefore, social need data collaboratives must extend beyond those who operate a database to include community-based organizations and social service providers who work actively with the historically underrepresented communities along with the most important stakeholders, actual members of the oppressed and affected population.
Launched in September 2020, the Connect Bay Area Network was created with these principles in mind. The group of five organizations works to de-silo and create alignment among health systems, public health institutions, and social service providers to promote equitable health outcomes for communities within the region. The group’s first resource, the Connect Bay Area Resource Guide, is designed to serve as a trusted source of information about community resources that relies on a continuous community participatory process to ensure accessibility to everyone, especially to those who are most oppressed.
We are not the first collaboration of this kind and certainly won’t be the last. We’re always learning from others and would love to hear from other data-sharing networks aiming to advance health equity. Reach out to learn more, get involved, or share your ideas/experiences.
A special thanks to Mary Carl, Bridget Darby, Elsbeth Sites, Lauren Fogel, Stacey Thomas, and the staffs of United Way Bay Area, Eden I and R, Contra Costa Crisis Center, and One Degree for their contribution to the blog and the creation of the Connect Bay Area Resource Guide.


