Reflections from Our Data Democratization Journey

As described in Part 1 of this blog series, I want to build on foundational principles in order to explore ways we can all promote and advance data democratization.
One of the things our Research & Development team works on is building prototypes of new data and technology tools. Our team includes specialists in: network innovations, including strategic planning and implementation of partnerships such as those in cross-sector care coordination; data analytics and research that support place-based impact measurement; and technology and software development. Across these fields, we commit to practices that are driven by communities, address historic and present day racial inequities, and target upstream systemic barriers. We also try to stay in the “hinterlands,” a place where things are not fully defined but where we must pay attention in order to share new and leading edge practices. As we stay on the edge of comfort and new knowledge, we try to share lessons with others who can then adapt, adopt, and scale tools for broader implementation.
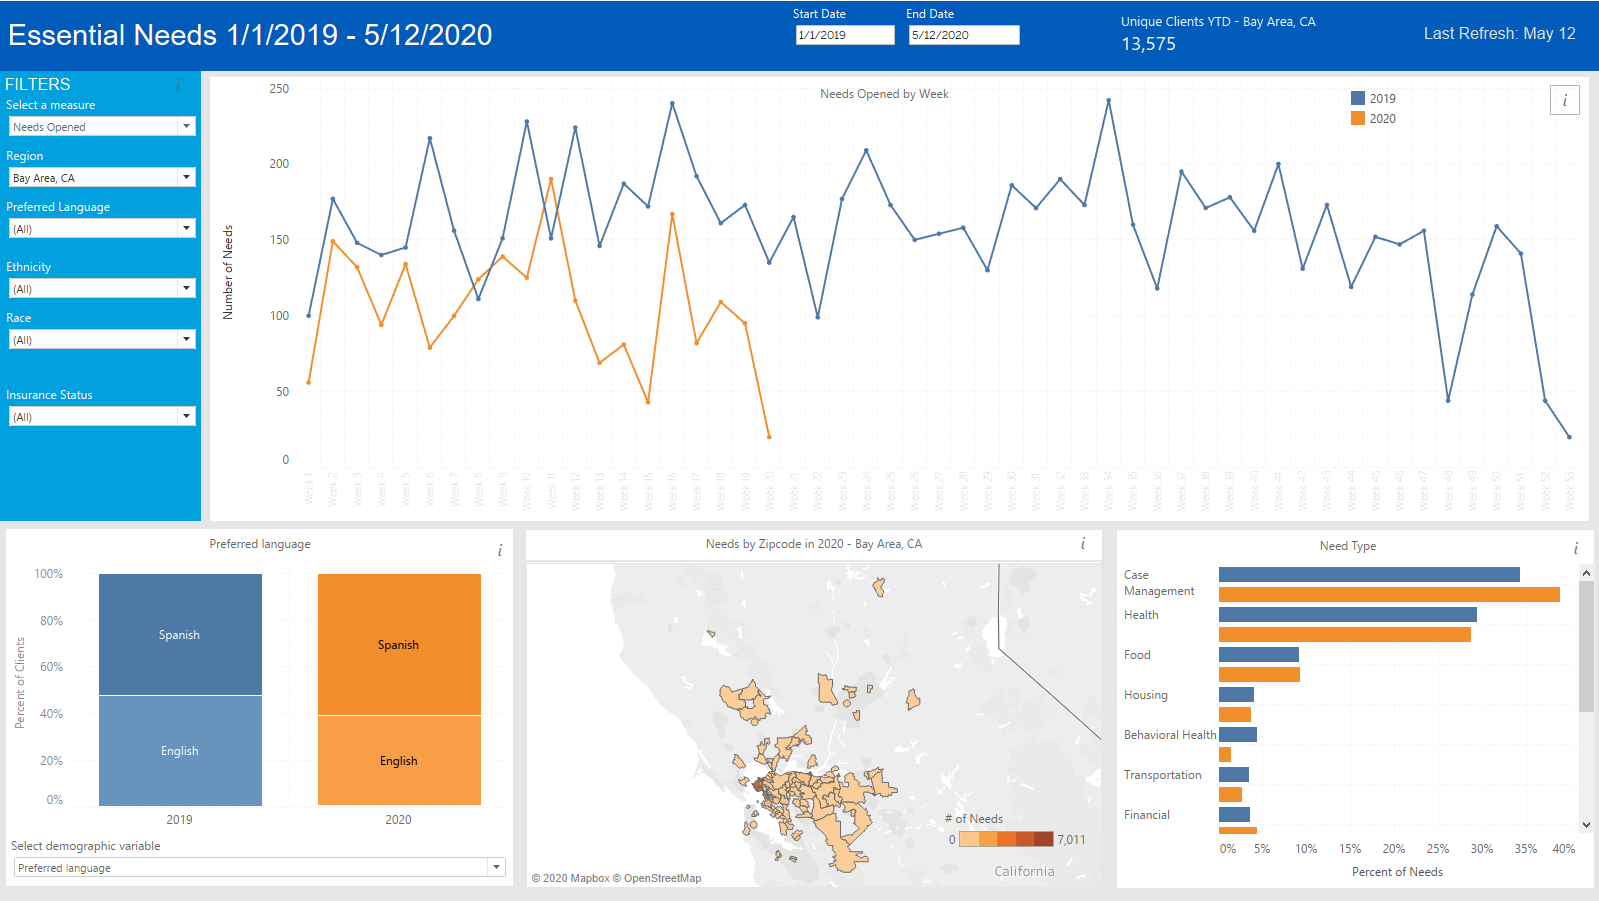
Most recently, our analytics team developed a prototype for an interactive dashboard that displays real-time data about essential resource needs and whether people are able to successfully connect to those resources. Because the data comes from multiple organizations, the visualizations are more powerful, but also makes agreements on who can see this data more complicated.The interactive dashboard would allow users to directly filter data by categories such as race, preferred language, insurance status, and geographical region. All the visualizations on the dashboard adjust according to the filter criteria so that the dashboard then displays trends that are of greatest interest to the user using real-time data. This is useful especially in the context of COVID-19 and shelter-in-place orders as we examine whether there are significant changes in food or housing needs compared to seasonal trends typical for springtime or summertime for a particular patient population. The dashboard also displays data by zip code on a map, which allows users to see how resource needs and connections vary from neighborhood to neighborhood.

While creating the prototype for this tool was useful in and of itself, the greater goal was to set the stage for learning how the development of new tools can provoke candid conversations about what works and doesn’t work when it comes to communities accessing data. Given Health Leads’ commitment to people being the owners of their own data, one of the big questions that surfaced was, “What does publicly accessible data even mean?” We say that public access to essential resource data is an important indicator of data democratization but on an operational level this could mean so many things, depending on the goal or intention behind making the data publicly accessible. Some of the users for our dashboard prototype are our own staff who rely on a case management system. Would departments outside of our own team have enough Tableau licenses to access data supporting the visualizations? If the dashboard were also being used by partner organizations, would they have access to Tableau? We could answer this question by making the visualizations available on a public option within Tableau but this brings about additional questions related to Protected Health Information (PHI). Visualizations are one element of access to data for users but another aspect of access is being able to see the underlying raw data that results in the graphs and maps. Let’s say we then made this real-time data dashboard available on our website so that anyone could download an up-to-date file of the data at any given time. Simply posting something on a public domain is not enough. Together, we must think carefully about what a community desires and demands in order to make use of data and drive toward systems change using that data.
Technical Considerations for Data Democratization: File Formats, Compliance, and Governance Structures
On a technical level, we could say that these data are publicly available if we put them on a public or user-facing website. But in its deepest and most meaningful way, what is this the best definition of community access? What kind of file format is publicly accessible? If data are available in a format that requires a particular type of software that might be expensive to license or require specific expertise to use, then the ability to download a file does not lead to meaningful public access.
In a recent project in collaboration with a large healthcare system, we have come up against the difference between “publicly available data” and “publicly accessible data.” Our partner wanted to be able to see where homeless people reside throughout the state of California. This data is collected at a regional level and reported to the US Department of Housing and Urban Development, who publishes it on its website. This “publicly available” data takes the form of one PDF per region per year. To run our own analysis on this data, we needed a machine-readable dataset. Tools that convert PDFs to machine-readable formats do exist, but they don’t work perfectly, and it would still be incredibly tedious to convert PDFs one at a time. By combining an existing R package with some additional programming to automate the workflow, we were able to create a machine-readable dataset of all of California’s homelessness data and create data visualizations that allow anyone to quickly and easily understand the landscape of homelessness in California. These visualizations will be posted online where anyone can view them.
We were able to take publicly available data and make it publicly accessible because we have the capacity and technical skills in-house. But for many organizations and individuals without an analytics team, or without the time to dedicate to such an endeavor, this data would remain inaccessible. Unfortunately, PDFs are the preferred method of publishing data for most governmental bodies and many nonprofits, so these robust datasets are effectively inaccessible to the public. Further, we are able to post our results online because the data is technically already publicly available, which we cannot do with most healthcare data, including our own in-house datasets.
Let’s say for now that the file format was something fairly common like .csv or .xls (Excel-friendly). Let’s also say that we post a data dictionary to accompany the file, along with a helpful video tutorial demonstrating how to analyze and interpret the data. Does that fully answer the call to community-owned and driven data? Perhaps it is a step forward, but it may still require familiarity with analytic methods. Conversely, if no raw data were available, but the resulting visualizations were accessible and easy to interpret for anyone regardless of disciplinary background, would we have achieved publicly accessible real-time data? Even then, we would have to think through the underlying data warehousing to make sure that the visualizations work in real-time. The warehouse would then have to align with multiple compliance standards. For example, in our cross-sector partnerships, we have learned that data generated in clinics and healthcare settings is necessarily limited because of PHI even if taking place outside of the hospital walls (say, at a neighborhood resource fair). HIPAA protects off site extensions of clinic work, including community events and any sign up sheets or surveys used during those events.
Additionally, one set of stakeholders may require HIPAA compliance and certain file formats. In that same care coordination network, another organization requires FERPA compliance and follows a different data management standard. In other settings such as AIRS accredited programs using resource and referral data from local 2-1-1s, it may be relatively easier to make data available. However, more and more collaborations are a combination of all of the above as well as smaller community based organizations that have their own commitments to ensuring that the rights of communities are uplifted and protected. This means that data democratization efforts that are committed to racial equity must hold space for multiple legal and compliance frameworks, always centering on what data ownership and data for change looks like from the people’s perspective.
Every lever has important consequences for the design and architecture of data and technology, all of which must be held accountable to the question of whether or not the tool is aligned with what a community wants. Some ways to ensure that this takes place is to 1) design prototypes with key stakeholders (whoever is most impacted by the data and who the data comes from) and 2) bring the questions that arise from prototypes directly to a community governance body so that they drive how those questions are answered and resolved.
Data Democratization as a Continuous Commitment
This is just one of many lessons we have learned – and we’re about to embark on several projects that will teach us more. If you or your team are interested in supporting data democratization, here are a few other steps and resources to help you in your journey:
- Understand that data democratization should be an authentically collaborative process.
Take the time to see data from a different perspective than just the technical. One place to start is Our Data Bodies // Nuestros Data Cuerpos’ Digital Defense Playbook. Grounded in popular education, this playbook includes tools for communities to reclaim data (in English and Spanish). One of the aims of Our Data Bodies is to surface how data and technology systems impact re-entry, fair housing, public assistance, and community development. The playbook is set up for facilitators to guide workshop participants through a wide range of topics centering on how data affects our daily lives and how awareness about data surveillance can empower people to make choices in digital defense. In addition to data defense, training materials and resources for data and democracy or how to perform a community health assessment are also available online. Another resource highlights the need for transparency in government, including open civic data. This includes a large initiative on open data and how community engagement can inform the process from policy to infrastructure and interpretation. - Develop a collaborative strategy early. Perhaps you already have a solid data infrastructure in place, but need to establish relationships with community groups to co-design how that infrastructure will be truly owned, accessed and driven by them. On the other hand, perhaps you already have a strong community coalition with diverse voices at the table, but you are not sure where to begin when it comes to gathering information and sharing it at a pace and scale that is more real-time than lots of letters, emails or meetings. In either case, think about how to partner with others who can help solidify a collaborative strategy for impact and accountability.
- Don’t wait to try something. But do take the time to learn from others who have long understood these principles. It is encouraging to be in a time when many people are committing to racial equity and data democratization. But sometimes the depth and breadth of racial inequity can be daunting and paralyzing – avoid paralysis by finding ways to operationalize your commitments and creating sustainable action plans. Also, take the time to learn from and uplift communities that have long understood these key principles and shared their vision. One example of ensuring that the people own their data comes from the Maiam nayri Wingara Indigneous Data Sovereignty Collective and the Australian Indigenous Governance Institute who outline key principles of data governance. Another example of data sovereignty and governance comes from the Native Nations Institute at the University of Arizona.
At Health Leads, we are taking the time to learn from examples inside and outside of the US, all while testing ways we can support this work in the space of health equity. We have shared some insights from a single prototype to outline how operationalizing principles through tool creation and implementation can underscore issues that haven’t been fully addressed and need further discussion. Talking about what’s working and what needs fixing promotes transparency and a continuous commitment to be part of the changes that need to take place if communities are to truly own and drive data practices.
These are just a few places to start. More than anything, I hope that these reflections and resources show that there is always a place for someone to start and a way for someone to continue their journey. In the spirit of continuously sharing learnings, I encourage you to look out for upcoming posts from our R&D team about specific projects and insights related to data, technology, and anti-racist practices. Let us know what is happening in your corner of the world as well so that we might collectively continue to further our understanding and championing of data democratization.
Acknowledgements: Elsbeth Sites, MPH for the preparation of the data dashboard and her insights on publicly accessible data.


